Mortgage Application Rates Part II: A/B Testing
- Sam Hamill

- Jul 11, 2020
- 2 min read
Updated: Oct 9, 2020

FYI: In my last post, we utilized pivot tables in Excel to compare the differences in loan origination rates and application denials based on an applicant's race and income class. The data resulted in my conclusion that, across the board, White applicants had higher approval rates and African Americans had higher denial rates in each income class.
1. What Are Our Null and Alternative Hypothesis (what we are testing)?
Process: From our pivot table data we found bias among an applicant's race and the origination rate. Given this information, we are asked to use A/B Testing to test if an African American applicant has a smaller chance of being approved for a loan than a White Non Hispanic Applicant (Our lowest and highest rates from pivot table data)

Conclusion: Because we know what we are testing (alternative hypothesis), we can conclude that the null hypothesis is the opposite.
2. How Will we Extract the Data We Need to Test?

Process: In order to perform an A/B test we need to identify our test group, control, group as well as the values for each column. In this case, we know we are going to test the origination rates (1=originated, 0=did not), so each row under these two columns will each contain an instance of this happening for each group. Make sure to paste special "values" under each column, otherwise Excel will include all rows.
3. What Type of A/B Test Will we be Running?

Process: To distinguish which type of test we will be running, we need to find the variance of each column (group). Doing so results in the above.
Conclusion: We found our variances to be significantly different enough to run T-Test assuming Unequal Variances. We don't have the population standard deviation, since this is a sample.
4. Running the A/B Test
FYI: Standard confidence rate is .95, so our alpha will be .05.
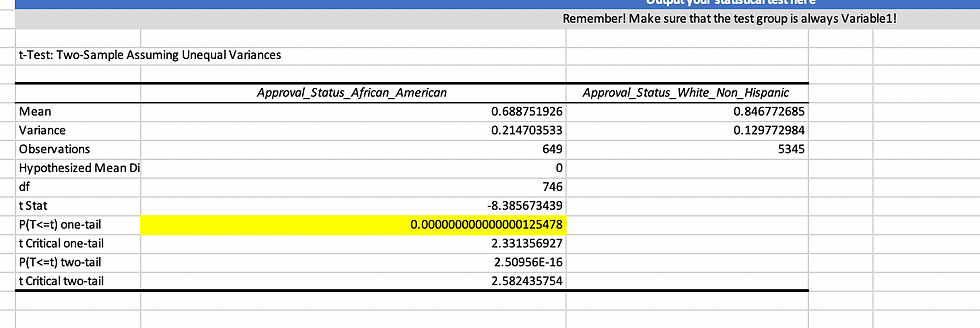
Process:
A. Since we are trying to determine an equality (whether something is greater than or equal to), then this is a one-tail situation. Had we been testing whether there is a statistically significant different between the two, then we'd be looking at two-tail.
B. Because we were testing whether our test group was less than our control group we are using a left one-tail test.
C. Last, but not least, we need to look at T Stat. Notice anything about it? The number is negative so this tells us that we accept our p-value for what it is (highlighted above).
CONCLUSION: Our test resulted in our p-value being far less than our alpha (.05), so we will reject our null hypothesis.
SUMMARY: After running an A/B test, from our data I can conclude, with 95% confidence, that a loan has a smaller chance of being approved if the applicant is African American than if the applicant is White Non Hispanic.
Coming Next......I'll be using Linear Regression models to see the impacts of race on loan interest rates, given an applicant's loan originated.


Comments